CHICAGO — It took four and a half months for Shannon Ross’ life to unravel.
Ross, who describes himself as Indigenous and a person of color, was arrested in Chicago in October 2019 on weapons charges and ultimately found not guilty. But that came only after he spent months in jail awaiting trial, lost his home, car, job and countless moments with his children.
Ross couldn’t afford the $75,000 bond set during a hearing that he recalls lasted only a few minutes.

Shannon Ross, who describes himself as Indigenous and a person of color, was arrested in Chicago in October 2019 on weapons charges, and ultimately found not guilty. But that came only after he spent months in jail awaiting trial, lost his home, car, job and countless moments with his children. Illinois will become the first state to completely abolish cash bail on Sept. 18, making the state a testing ground for how eliminating it works on a large scale.
“I had to lose everything to prove that I wasn’t guilty,” he said. “It messes with you mentally, psychologically. It messes up relationships; it messes up the time you put in to build your life up.”
But Illinois is about to overhaul the system that upended Ross’ life. Illinois’ Pretrial Fairness Act, which abolishes cash bail as a condition of pretrial release, will take effect Sept. 18, making Illinois the first state to end cash bail and a testing ground for whether — and how — it works on a large scale.
People are also reading…
Judges can still keep people accused of serious crimes behind bars pretrial, but first would have to go through a more rigorous review of each case.
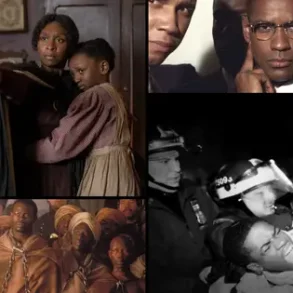
Critics say cash bail policies are especially unfair to Black people and other people of color. A 2022 federal civil rights report on cash bail systems found that courts tend to impose higher pretrial detention penalties on Black and Latino people, citing a study that showed Black men received bail amounts 35% higher than white men, and Latino men received bail amounts 19% higher than white men.
Cook County Public Defender Sharone Mitchell Jr. described Illinois’ previous cash bail system as “a cousin to slavery.”
“The vast majority of people in the system are poor, and they’re Black and brown, and they have no power. It is an incredibly unfair system,” he said. “You go to a bond hearing, it sounds like a slave auction. People are talking very fast. They’re putting price tags on people’s freedom.”
Between 1970 and 2015, there was a fivefold increase in the number of people jailed before trials, according to the 2022 U.S. Commission on Civil Rights report. Data shows more than 60% of defendants were detained prior to trial because they couldn’t afford to post bail, and that nearly 74% of the 631,000 people jailed daily in the United States are awaiting trial.
Typically in state courts, a judge decides if a defendant poses too much of a threat to the community to be released, or if they can be freed with conditions, according to the nonprofit Bail Project.
Some states have tried to ease cash bail rules.
In 2017, New Jersey essentially replaced its cash bail system with a risk assessment process that gauged the potential danger a released defendant could pose to the community. But cash bail is still allowed in some instances in that state and others that have curtailed the practice, such as New York and Alaska.
California has made several efforts to reform its cash bail system, but lawmakers balked at sweeping reform.
Proponents of cash bail argue that it ensures released defendants show up for court proceedings, and say that without it, violent criminals who are released pending trial could have the opportunity to commit more crimes. But New Jersey data showed that after the state moved away from cash bail, the number of defendants who were charged with a new crime or who failed to appear in court remained steady.
Race certainly seemed to play a role when Nikuya Brooks’ bond was set at $150,000 after her first-time arrest on drug charges in 2017, according to the Chicago mother of three. No one in her family could pull together 10% of the bond for her to walk free.

Nikuya Brooks stands on the porch Aug. 11 with her 16-year-old daughter Gabrielle Jones, left, and their dog Snowball in Chicago. Brooks’ bond was set at $150,000 after her first-time arrest on drug charges in 2017, an insurmountable amount for the mother of three.
Brooks, who is Black, said a white woman she was jailed with had prior convictions and the same charges as Brooks, but received a lower bond.
According to Brooks, she didn’t know her ex was transporting ecstasy while she was in the car. Police stopped the vehicle and arrested both. She said she spent a year in DuPage County Jail before her trial, unable even to hug her children.
“I really wanted to fight my case because I’m not a criminal,” she said. “I’m not a drug dealer. I’m a mom. You know, I bake cookies for the PTA. I ran a Girl Scout troop.”
Brooks said other women in jail told her if she pleaded guilty, prison visits offered more freedom and that she might be able to hug or kiss her children. She told her public defender she wanted to make a deal, and ended up serving about two more years in prison.
Years later, she still struggles to find employment because of her criminal record.
“You’re already being punished because you’re being detained,” she said. “But you’re also being punished twice because you’re poor.”
Ross, who was cleared of the weapons charges that put him in jail, said he also struggles to find secure housing and income four years later. He lost his job as a forklift operator while jailed. Once he made bail with the help of the Chicago Community Bond Fund, Ross started a business online during pretrial house arrest. But he said his credit score tanked after he couldn’t make payments from jail.
“I feel like it was a Catch-22,” Ross said. “And the worst part about it is I knew I was not guilty.”
Reflecting on their experiences, Brooks and Ross said being locked up pretrial harmed their chances in court. “You’re automatically stigmatized if you’re incarcerated and you’re fighting your case, especially Black women,” Brooks said. They hope the new law will change that for others in Illinois.
“It’s more equal for everyone,” said Ross. “I feel like it’s more justice in the criminal justice system.”
The best cities to move to for diversity
The Best Cities to Move to for Diversity

Photo Credit: fizkes / Shutterstock
The U.S. has long been known for its diversity relative to other nations. For hundreds of years, migration and growth have brought people of countless different backgrounds to the American melting pot. And the U.S. today is only growing more diverse over time, and frequently in new ways.
Diversity in the population can have a number of definitions or interpretations, which has made it complicated for demographers to measure. Individuals who identify as some kind of racial or ethnic minority have become an increasing share of the population, but people increasingly have multiracial or multiethnic identities as well. And within different racial or ethnic categories, birthplace and migration history or ancestry can also affect how people identify and how they experience their identity day-to-day.
At a high level, however, one simple but significant sign of the diversification of the U.S. population is the decreasing share of people who identify as White alone, not Hispanic. This category represented 59.9% of the U.S. population in 2020, down from 64% in 2010 and 78.2% in 1980. In a handful of states, non-Hispanic Whites now represent less than half of the population, and demographers anticipate that the U.S. as a whole is likely to become “majority-minority” sometime in the 2040s.
The minority population share has nearly doubled over the past 40 years

Despite America’s rapidly diversifying population, reducing economic inequality across demographic groups remains a key issue among policymakers. People identifying as Black and American Indian have historically fared worst. Black American households have the lowest median income of any group at $43,674 and American Indian households are second-lowest at $45,877. With regards to poverty, American Indians lead all groups with a poverty rate of 24.1%, followed by Black Americans at 22.1%. In contrast, Asian Americans tend to fare better economically than members of other racial and ethnic minority groups, with a median household income of $91,775 (highest among all groups, including Whites) and a poverty rate of 10.6% (second only to Whites at 9.3%).
Minority populations in the US are more likely to experience poverty

Because of this, locations with very high or very low levels of demographic diversity may offer disparate economic conditions for different groups. For example, Texas and California both rate relatively highly for racial and ethnic diversity, but they have wide economic inequality between racial groups. New England states including Maine, New Hampshire, and Vermont are among the least racially and ethnically diverse but also most economically equal states. Hawaii, on the other hand, stands out for offering high levels of both racial and ethnic diversity and economic equality. This makes Hawaii a top location for those wishing to enjoy the social and cultural benefits of diversity along with widely shared economic well-being.
Hawaii stands out as one of the best states for diversity

At the metro level, a number of cities offer similar combinations of diversity and equality. According to a composite index that includes racial/ethnic diversity, birthplace diversity, and economic equality, many of the best U.S. cities for diversity are located in the Western U.S. Cities in states like California, Colorado, and Arizona have growing and increasingly diverse populations due to high rates of immigration, and they are simultaneously experiencing economic growth that benefits their diverse residents.
The data used in this analysis is from the U.S. Census Bureau’s 2020 American Community Survey. To determine the best locations to move to for diversity, researchers at Filterbuy calculated a composite index based on equally-weighted indices of ethnic/racial diversity, birthplace diversity, and economic equality. To improve relevance, only cities with at least 100,000 residents were included. Additionally, cities were grouped into cohorts based on population size: small (100,000–149,999), midsize (150,000–349,999), and large (350,000 or more).
Here are the best U.S. cities to move to for diversity.
The best small and midsize cities for diversity

15. Albuquerque, NM

Photo Credit: Sean Pavone / Shutterstock
- Composite index: 53.97
- Ethnic/racial diversity index: 60.80
- Birthplace diversity index: 57.10
- Economic equality index: 44.00
14. Portland, OR

Photo Credit: Sean Pavone / Shutterstock
- Composite index: 54.76
- Ethnic/racial diversity index: 49.40
- Birthplace diversity index: 61.80
- Economic equality index: 53.07
13. Jacksonville, FL

Photo Credit: Sean Pavone / Shutterstock
- Composite index: 55.49
- Ethnic/racial diversity index: 64.20
- Birthplace diversity index: 60.00
- Economic equality index: 42.27
12. Seattle, WA

Photo Credit: f11photo / Shutterstock
- Composite index: 55.68
- Ethnic/racial diversity index: 56.90
- Birthplace diversity index: 66.10
- Economic equality index: 44.03
11. San Francisco, CA

Photo Credit: f11photo / Shutterstock
- Composite index: 56.06
- Ethnic/racial diversity index: 69.80
- Birthplace diversity index: 71.90
- Economic equality index: 26.47
10. Mesa, AZ

Photo Credit: Christopher M Hall / Shutterstock
- Composite index: 56.82
- Ethnic/racial diversity index: 54.80
- Birthplace diversity index: 60.40
- Economic equality index: 55.27
9. Colorado Springs, CO

Photo Credit: Jacob Boomsma / Shutterstock
- Composite index: 57.20
- Ethnic/racial diversity index: 50.00
- Birthplace diversity index: 54.00
- Economic equality index: 67.60
8. Arlington, TX

Photo Credit: Peter Witham / Shutterstock
- Composite index: 59.40
- Ethnic/racial diversity index: 71.20
- Birthplace diversity index: 64.00
- Economic equality index: 43.00
7. Sacramento, CA

Photo Credit: Andriy Blokhin / Shutterstock
- Composite index: 60.01
- Ethnic/racial diversity index: 76.20
- Birthplace diversity index: 57.20
- Economic equality index: 46.63
6. San Diego, CA

Photo Credit: Dancestrokes / Shutterstock
- Composite index: 60.09
- Ethnic/racial diversity index: 69.70
- Birthplace diversity index: 67.90
- Economic equality index: 42.67
5. Virginia Beach, VA

Photo Credit: Alexandr Junek Imaging / Shutterstock
- Composite index: 60.19
- Ethnic/racial diversity index: 58.00
- Birthplace diversity index: 59.00
- Economic equality index: 63.57
4. Anaheim, CA

Photo Credit: John Roman Images / Shutterstock
- Composite index: 60.93
- Ethnic/racial diversity index: 62.80
- Birthplace diversity index: 63.60
- Economic equality index: 56.40
3. Aurora, CO

Photo Credit: Jacob Boomsma / Shutterstock
- Composite index: 61.49
- Ethnic/racial diversity index: 69.20
- Birthplace diversity index: 67.20
- Economic equality index: 48.07
2. Tucson, AZ

Photo Credit: Sean Pavone / Shutterstock
- Composite index: 61.69
- Ethnic/racial diversity index: 61.30
- Birthplace diversity index: 62.50
- Economic equality index: 61.27
1. San Jose, CA

Photo Credit: Uladzik Kryhin / Shutterstock
- Composite index: 62.92
- Ethnic/racial diversity index: 70.30
- Birthplace diversity index: 67.90
- Economic equality index: 50.57
This post was originally published on this site be sure to check out more of their content.